
ES · EN
Contact us
Georeference and anticipate
One detection in isolation is useless. If each one arrives with place and time, it can be drawn on a map, filtered by zone and crossed with other layers. With months of history, predictive analytics can flag where the next incident will be.
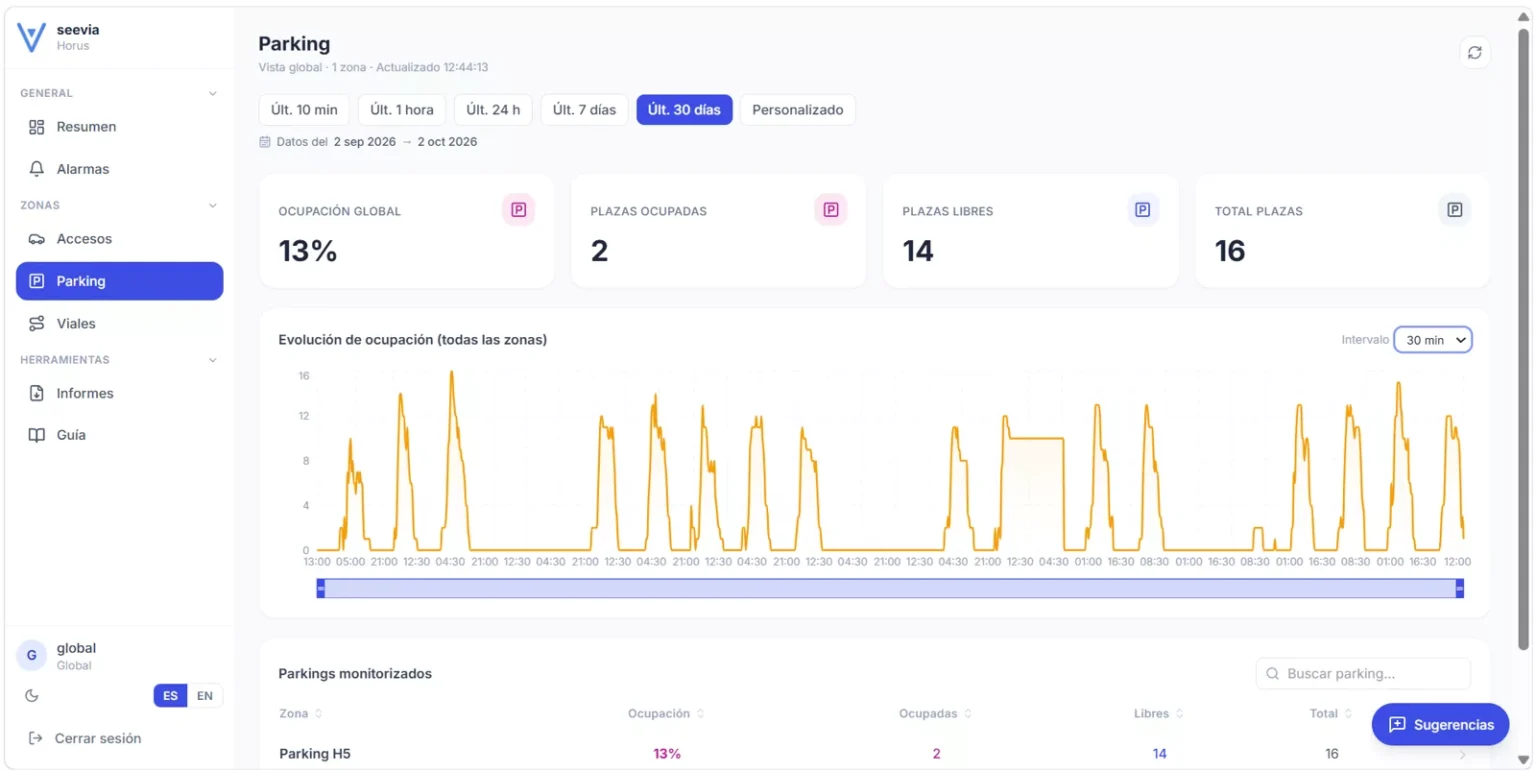
Car park occupancy through the day, on the Seevia Horus dashboard.
Georeferencing means each detection says where and when: not just that there is waste, but on which street at what time. It can be drawn on a map, filtered by zone, crossed with other layers in a GIS. Prediction grows with use.
Many organisations have cameras, but their data sits in video or loose spreadsheets. Without place or history you cannot prioritise, justify contracts or compare month to month.
Illustrative diagram
01
Vehicle GNSS or known position of fixed camera.
02
Only metadata travels: type, time and zone, never the video.
03
Counts, occupancy and alerts by zone and period in dashboards.
04
Mapping, satellite or weather data, link to GIS.
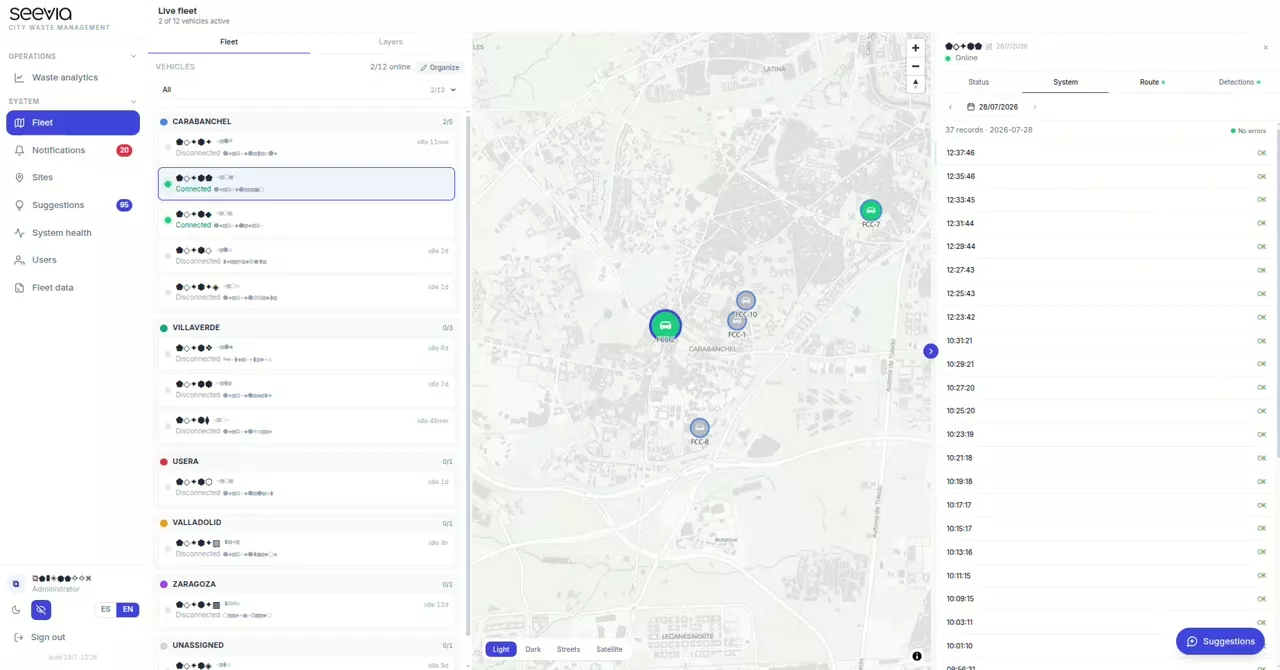
Each alert, on the management app's map.
Indicators, history and alerts about what happens on the street or on site.
Yes. Data reaches the tools you already use.
The client. They decide what is stored, for how long and with whom it is shared.
Tell us your case and we will look at it with your data.
Next
Privacy by design